Posted on: 9th December 2016 by Kyle Smith
This blog looks at the Innoval Spray Impact Model (ISIM). ISIM simulates the spray cooling of rolls in aluminium rolling mills. Roll temperatures during rolling are important for lubrication and flatness control.
The inputs to ISIM include the geometry of the sprays and their flow rate. The results tell you the temperature of the rolls during the rolling process.
Spray cooling with three spray banks
Many mills use three rows of sprays to provide control over the amount of roll cooling applied. The flow rates in the three rows are in the ratio 1-2-4. Switching rows on and off with this system allows for 7 control levels. For example 1 + 2 = 3 and all rows on gives level 7.
The example we will look at below is a cold mill with rolls that are 0.3 metres in diameter. This will show the challenges presented by cooling cold mill rolls with three rows of sprays.
ISIM has two windows, a main inputs window and a graphical output window. Other outputs are generated in text files.

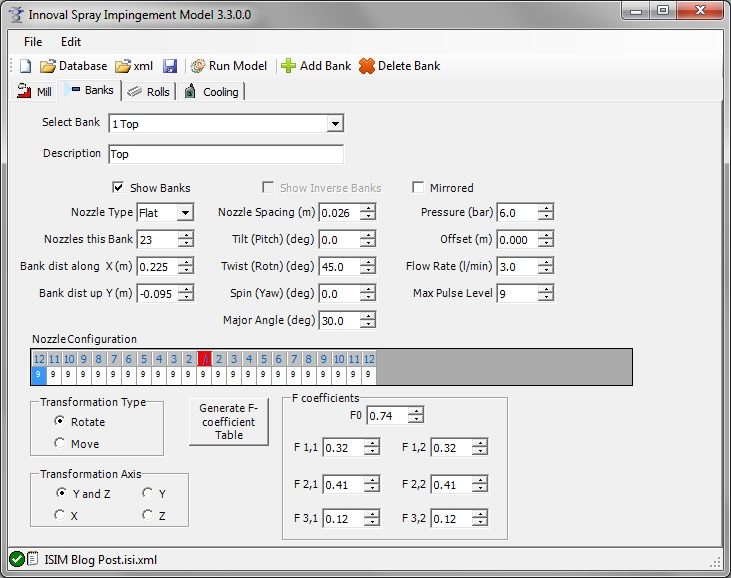
You can select individual rows (‘banks’) of sprays using a drop down menu. The flow rates in this example are 3, 6 and 12 litres per minute (per nozzle). The nozzles in the top row have the lowest flow rate and the nozzles in the bottom row have the highest.

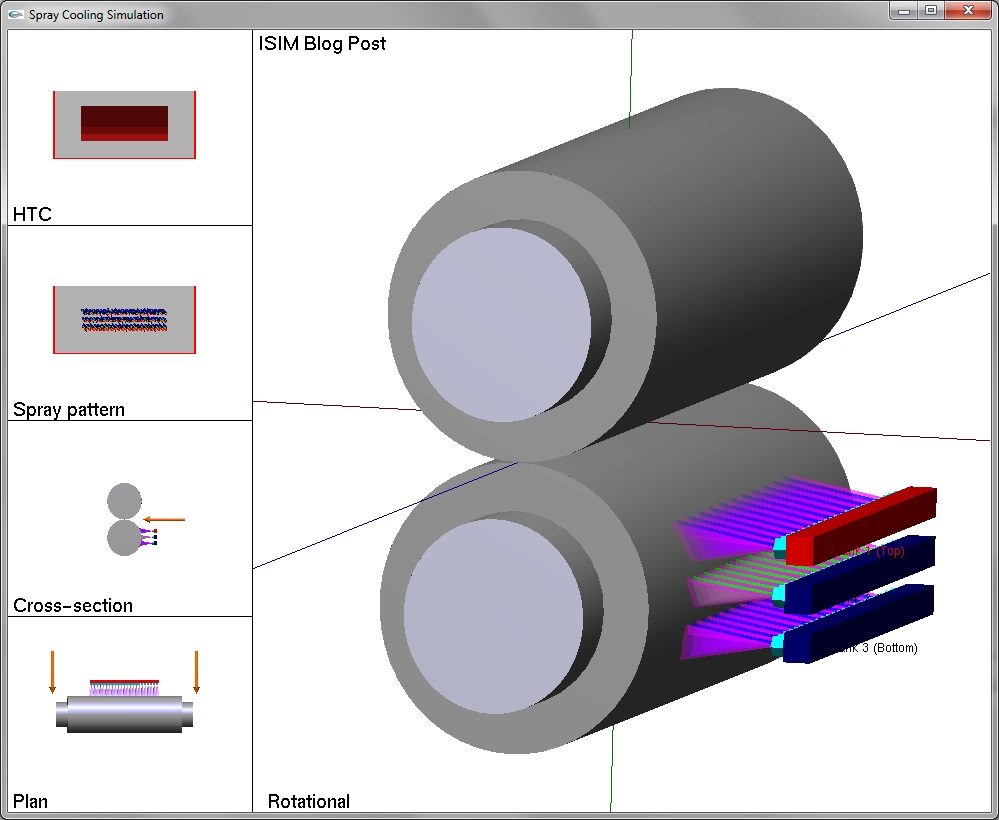
The output window shows a three dimensional view of the spray cooling system. You can change the main view in the window to show the spray pattern on the rolls. The different colours in the spray pattern are for minimum, maximum and nominal roll sizes.
Heat transfer coefficient
The temperature of the rolls depends on the overall heat transfer coefficient (htc). The htc is directly proportional to the power of the cooling. It is inversely proportional to the area cooled and the temperature difference between the coolant and the roll. Hence it has units of kilowatts per metre squared Kelvin, or kW/(m²K). In this example the overall htc is 4.98 kW/(m²K).

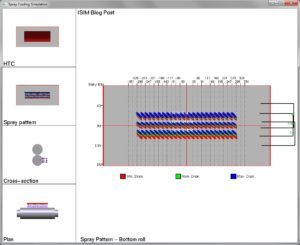
The model also shows the zones of influence for each row on the roll. These are the black brackets to the right of the spray pattern picture above. In this example we can see that the zones of influence overlap with each other a lot. This means that the interactions between the different rows reduce the effectiveness of the cooling.
Switching off sprays
If we switch off the centre row of sprays there is much less interaction between the rows. Consequently, the htc reduces to 4.65 kW/(m²K), but the applied coolant is being used more efficiently. There is now also some spare coolant available from the pump. It’s possible to split this between the remaining two rows by increasing their nozzle sizes. As a result, the new htc is 5.51 kW/(m²K). This is 10% greater than with three rows, so more heat can be extracted from the rolls. Since roll temperature is important for flatness control this means that higher roll speeds are possible.
Using this result in the Innoval Rolling Model shows that even this small increase in htc can potentially give a 30% speed increase. Accounting for threading, this would lead to around a 25% increase in productivity; all from a careful study of the physics of roll cooling. However, switching to two rows does not of course give seven levels of cooling. Instead, the valves can be pulsed on and off for different lengths of time to change the overall cooling. Furthermore, pulsed systems have other advantages over level control using row switching as discussed in a previous blog post.
The above example demonstrates that using three rows of sprays on a cold mill can be very inefficient, particularly when work roll diameters are small. Much of the improvements we make to spray cooling systems during our consultancy work relates to issues with application geometry leading to inefficient cooling performances. In conclusion, it’s true to say that cooling performance is not only about applied coolant flow!
This post was originally written by Dr Timothy Clemson who has now left the company. Please contact Kyle Smith if you have any questions.


